For example, when examining the trajectories of population numbers between resistant and susceptible genotypes—such as setting a 95% confidence interval for the ratio of resistant to susceptible individuals—a distribution of 1,000 bootstrap replications is required. However, if the analysis were conducted by examining each replication one at a time, with only one replication performed per day, it would take nearly three years (1,000 ÷ 365). If I could do three replications a day, I would reach 1,000 replications in less than a year. Believing that steady daily progress would get me to my goal, I made it a habit to accumulate bootstrap replications each day, spending almost the entire day completing just three. In the previous Miyo and Charlesworth (2004) paper, bootstrap standard errors were estimated from a distribution of 170 replications. In this study, I resampled the same data set and added 830 additional replications to estimate 95% confidence intervals, bringing the total to 1,000 replications. Since the original data set remains the same, this also serves to confirm the accuracy of the standard error estimates in Miyo and Charlesworth (2004). If the bootstrap procedure had been performed exactly as described in the textbook, the estimated standard error (calculated as the standard deviation of the bootstrap replications) should change very little when the number of replications increases from 170 to 1,000. This would objectively indicate that fair resampling of the original data set was conducted in each bootstrap replication. Below are graphs showing how the standard error estimate of the log-transformed ratio of resistant to susceptible populations at 100 days changes as the number of bootstrap replications increases. The distribution of 1,000 bootstrap replications is also shown. These are the actual graphs used in the subsequent paper (Miyo [2018], Figures 3 and 4). I think it clearly shows that as the number of replications increases, the estimated standard error (the standard deviation of the bootstrap replications) remains almost constant, and that the distribution of the log-transformed bootstrap replications, being ratio data, appears to be normally distributed.
(translated version of the post on December 06, 2021)
このように、例えば、抵抗性と感受性の遺伝子型との間の集団の個体数の変遷について、例えば、感受性の個体数に対する抵抗性の個体数の比の95%信頼区間を設定するときに、1000ブーツトラップ・レプリケーションの分布が必要になるわけですが、1回ずつそれぞれのレプリケーションを吟味しながら分析を進めていく場合、1日に1レプリケーションしかできなければ、3年近くかかってしまうことになります(1000 / 365)。しかし1日に3レプずつ積み上げることができれば、1年かからずに1000レプリケーションを積み上げることができる計算になります。なので、毎日少しずつやれば必ず到達できると信じ、1日3レプずつ増やすことを心がけながら、ほとんど毎日のように、1日かけてブーツトラップ・レプリケーションを増やしていきました。以前のMiyo and Charlesworth(2004)の結果は、170レプリケーションの分布に基づいてブーツトラップ標準誤差の推定をおこないました。今回も、同じデータ・セットを用いてリサンプリングを行い、さらに830レプリケーションを追加して、1000レプリケーションとして95%信頼区間の推定を行うことにしました。これは、もともとのデータ・セットは同じなわけですから、Miyo and Charlesworth(2004)の標準誤差を推定したときの分析の正確さの確認にもなるわけです。このブーツトラップの手順が教科書通りに行われていたならば、ブーツトラップ・レプリケーションの数が170から1000に増加しても、ブーツトラップ・レプリケーションの標準偏差として推定される標準誤差の推定値は、ほとんど変化しないはずなので、それぞれのブーツトラップ・レプリケーションにおいて、もともとのデータ・セットからのリサンプリングがフェアーに行われたことを客観的に示していると言えるのではないかと思います。ブーツトラップ・レプリケーションの数が増加していくにつれて、100日後に感受性の個体数に対する抵抗性の個体数の比(対数変換してある)の標準誤差の推定値がどのように推移していくかを示したグラフ、および1000ブーツトラップ・レプリケーションの分布についてのグラフを以下に示しておきました。これらは、実際にはこれから述べることになる以後の論文の中で用いたグラフです(Miyo [2018]、図3および4)。レプの数が増加しつつあるなかで、ブーツトラップ・レプリケーションの標準偏差として推定される標準誤差はほとんど変化がないこと、そして比率データということで対数変換したブーツトラップ・レプリケーションの分布が正規的であることが明確に示されていると思います。
(2021年12月6日のポストを再掲)
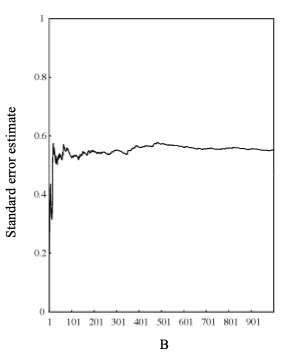
Taken from Figure 3 in Miyo (2018). Trends in the estimated standard error, calculated as the standard deviation among bootstrap replications up to 1,000. Even as the number of bootstrap replications increased, there was little change, suggesting that the bootstrap method was performed exactly as described in the textbook.
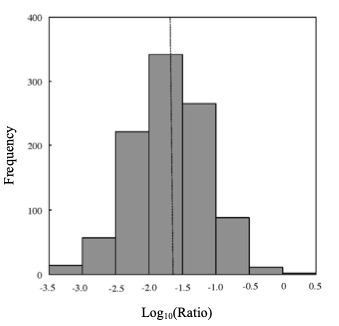
Taken from Figure 4 in Miyo (2018). Bootstrap distribution of log-transformed values (B = 1000) based on ratio data. The mean of the bootstrap replications was -1.6948, while the value based on observed data was -1.6522. The estimated standard error was 0.5526, and the bias—the difference between the value based on observed data and the mean of the bootstrap replications—was -0.0426. These results suggest that the analysis was performed exactly as described in the textbook.